The Commons
What makes public space generate civic life? An exploration of the idea — informed by data from 32 cities.
Is there space for me?
Not "is there a restaurant nearby" — WalkScore already does that. The question is: if I want to do something this week — not watch, not consume, but participate — is there space? A stage to rehearse on. A kitchen to cook in. A maker space to build in. A civic room to organize in.
That's what CommonScore measures — participation infrastructure across 16 dimensions.
The Convention City Almanac applies this lens to 32 cities and their convention centers. The data shows a pattern: the cities that score highest don't just host conventions. They build year-round participation infrastructure around the building.
New York (#1, score 38). Seoul (#2, 37). Boston and Amsterdam (tied #3, 32). These cities treat their convention centers as anchors for daily civic life, not as episodic event venues that empty out between bookings.
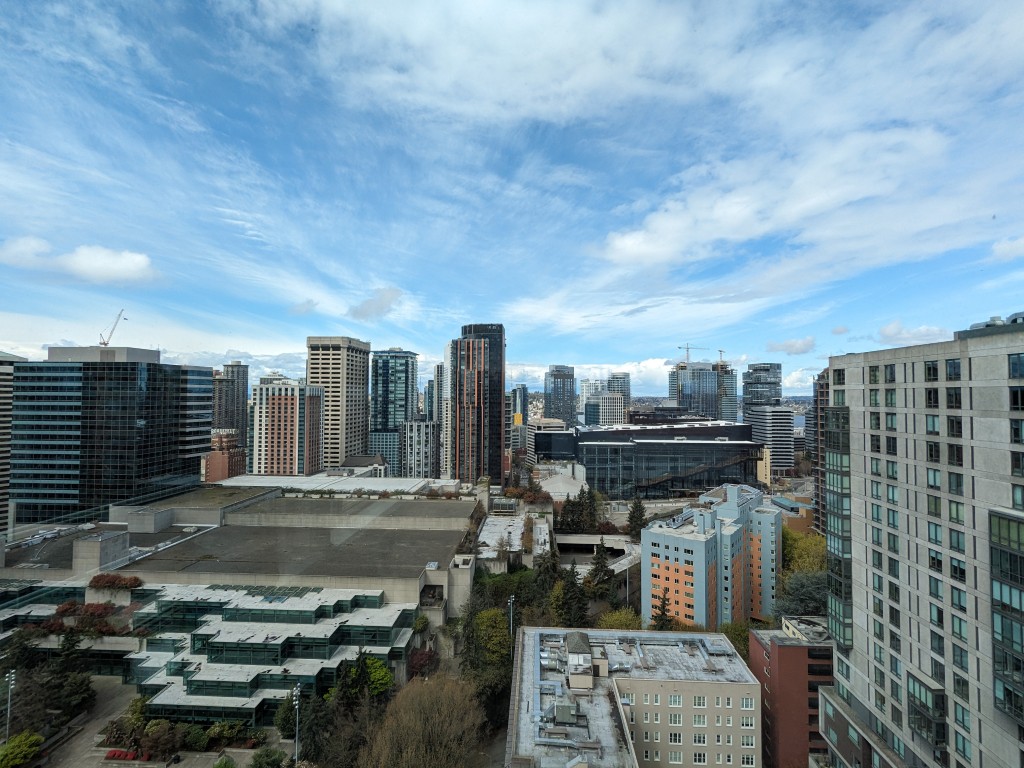
Seattle scores 27 — #18 of 32 cities, tied with Austin and Cape Town. The convention center contributes 16% of that score, entirely through industry networking and mega-events. The other 84% was built by libraries, community centers, Pike Place Market, makerspaces, and music venues.
A compass, not a map
CommonScore is a directional instrument. It measures 16 dimensions of public participation space — food, civic, education, arts, music, makers, markets, kids, seniors, wellness, gaming, theater, sports, robotics, industry networking, and mega-events — weighted by how much each dimension contributes to daily civic life.
The scores are approximate. They're based on public sources, site visits where possible, and structured judgment calls about availability and scale. Two researchers scoring the same city independently would land in the same neighborhood, not on the same number. A city scored at 27 might be a 25 or a 29. The ranking is directional: Seattle is in the middle of the pack, not the top or the bottom.
What the scores are good for: identifying patterns. Cities that score above 30 tend to have convention centers embedded in daily-use public infrastructure — food halls, transit connections, civic programming. Cities below 25 tend to have convention centers that operate as isolated event venues. The gap between those two models is what we're studying.
What the scores are not: a facility guide, a policy prescription, or a ranking you'd cite in a bond prospectus. They're a compass pointing toward the cities worth learning from — and the dimensions where Seattle has room to grow.